Fragile Families Challenge

What is Fragile Families Challenge
Fragile families challenge (FFC) is a community challenge that all participants share their methodology and code to achieve one common goal to understand the struggles and improve the lives of disadvantaged children in the United States. You can find much more information about the challenge from its official website.
My participation to this important challenge started with an email that I received in April 2017. Matt Salganik from Princeton University was visiting our campus to give a talk about his research and upcoming challenge that he is organizing with Ian Lundberg and Sara McLanahan. I also highly recommend this book Bit by Bit: Social Research in the Digital Age :) He was also organizing a “getting started workshop” in our campus. This was one of the driving force for me to participate this challenge. Another interesting aspect of this challenge is the opportunity to combine social science and computational approaches to address this problem.
In his slides here, Matt gives a great introduction to the challenge, but he also highlights why we (social and computational scientists) should work on such problems together. I really liked his comparison of these two groups: social scientists () and data scientists ().

My approach on the problem
In this problem, my approach based on machine learning methodlogies where I can employ learning models that can describe underlying data. My expectation is to learn from the models about factors important for the predicting certain outcomes.
Data preprocessing
Before diving into difficulties of this dataset, let me first describe what type of data we studied for this challenge. After completing the agreement for the data usage and downloading the dataset, I had 2 main files: background.csv and train.csv
Background file consist of 4,242 rows (one per child) and 12,943 columns. Columns in this data represent answers for survey questions. Design of the survey consist of 5 waves from birth to age 9. Training data have 2,121 rows (one per child in the training set) and 6 outcome for age 15. Our task is to use available features among 12,943 column to predict 6 outcomes for kids at the age of 15.

First thing I noticed when I started to analyze this dataset, it has significant amount of missing values. These missing values usually systematic and one should take this into account.
My initial attemp is to discriminate different types of features. Features about different waves, parent, categories, etc. I implement couple of helper functions to be able to select features from different waves or specifically answers from mother etc.
After analyzing different categories of features, I decided to remove the set of features that is not available for all the users. I could work on dealing with the missing values, but since we have plenty of survey answer decided not to focus on that. However, there are some recommended appraoches here.
Building models
I built classification and regression models for different outcomes. Categories “gpa”, “eviction”, and “material hardship” requires continuos values so my choice for this task was Random Forest Regression and other 3 categories I fit Random Forest Classification.
I tried different set of features. I explored different waves, different parents, etc. My best performing model to predict GPA is using all the available feature in wave 5 (3,236 features available with this criteria). General model used in this analysis sketched below.
RandomForestRegressor(bootstrap=True, criterion='mse', max_depth=None,
           max_features='auto', max_leaf_nodes=None,
           min_impurity_split=1e-07, min_samples_leaf=1,
           min_samples_split=2, min_weight_fraction_leaf=0.0,
           n_estimators=100, n_jobs=1, oob_score=False, random_state=None,
           verbose=0, warm_start=False)
Evaluation of submissions
For the evaluation I followed their performance metric: MSE. Organizers describe their system for evaluation here. Below is the general formula of how they evaluate different outcomes

I employed cross validation mechanism to estimate performance of model on the traning dataset. Later I build a single model using all the available traning data.
Between different submission I tracked the leader board score, my submission score computed on heldout dataset, and my previous attemps. Please note that my estimation is based on the training data and actual leader board results evaluated on heldout dataset. Below is my analysis on different models that I submitted. I always keep the best model that I tested in the final submission.

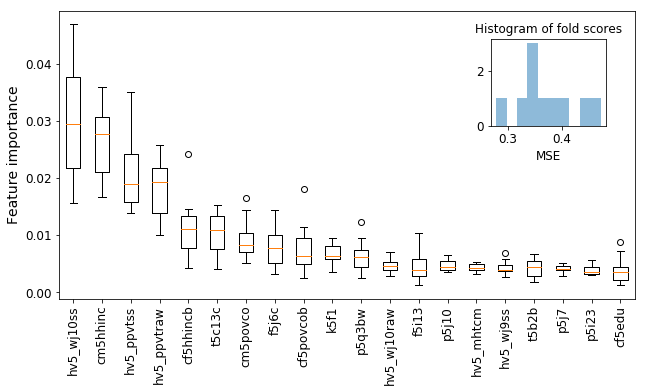
Once organizers announced the results, I analyzed my model to highlight features found to be most relevant. Below is the top scoring features.
| Feature name | Description |
|---|---|
| hv5_wj10ss | Woodcock Johnson Test 10 standard score |
| cm5hhinc | Constructed - Mother’s Household income |
| hv5_ppvtss | PPVT standard score |
| hv5_ppvtraw | PPVT raw score |
| cf5hhincb | Constructed - Household income mother report for married/cohab if available |
| t5c13c | c13C. Child’s mathematical skills |

Notes and take aways
After building some off-the-shelf methods to estimate outcome of kids in this dataset, I am still not feeling that I gained much intuition about the cause of problem. I am happy to learn more about approach in the workshop :) I hope community effort will help to build ensemble of models that can point some interesting insights about the problem.
My repository is also publicly available through Github: github.com/onurvarol/FragileFamiliesChallenge
My notes from the conference
I am going to share my notes from the FFC scientific workshop, which will take place November 16th and 17th (Thursday and Friday) at Princeton University. I am also going to give a talk about my approach described in this blog post at the workshop.
Details about the event is here.
Slides of my presentation is located here
